Your product is talking. Are you listening?
A metrics pipeline using StatsD, Graphite and Team Dashboard
Why measure
We all know that it is necessary to rely on accurate and timely data to improve your product. The issue is that commonly available data, like that provided by Google Analytics, simply isn’t enough. In fact, is about something completely different.
Google Analytics is a great tool for helping you understand your website visitors, content performance and conversion funnels. But what about how customers are using your product? Are you measuring the KPIs as defined by your business model? Did recent changes to your product have the intended impact? What about measuring the volume of transactions around which you design pricing structures? All these are important questions to answer when making decisions about where to focus your efforts. A quote from Jack Dorsey’s Foundation interview first pointed me in the right direction.
You need to have an understanding of the momentum of what your doing and then where your going, you can only do that with data.
— Jack Dorsey
How to measure
In order to gather this data we need a tool that’s simple for developers to drop into their code, if things are too complicated they won’t get used. Also, although these metrics are important, you need to make sure you implement them in a way that they don’t degrade the user experience.
The solution isn’t trivial. There’s nothing that “just works” out of the box and the configuration is as unique as your business model. Here’s what we do to monitor the various metrics that are important in the context of our own model. This is one way to do it and I am sure there’s many others. Of course it all depends on what you need to track and what technologies you are comfortable with.
StatsD
We are using a tool from Etsy called StatsD. It is a simple network daemon that listens for various types of stats: counters, timers and gauges. StatsD will collect events in memory and periodically flush them to various pluggable backend services. Various ports of the project are available but we’re using the NodeJS version.
Using a tool like StatsD has many advantages over having your application code talk directly to one of the backend services:
- Your application only has to know how to speak to StatsD. Client libraries are available for many languages, you can see a list here.
- All the heavy lifting is handled by the StatsD daemon, load on your application + backend services is also reduced since metrics are aggregated in memory before being shipped out.
- You don’t need to worry about where your backend services live, instead, have a StatsD instance running on each server you own. In our setup we use a repeater backend to ship metrics to a central StatsD daemon, which then forwards to our Graphite backend.
- StatsD uses UDP which is a lightweight “Fire & Forget” style network protocol, if StatsD isn’t running on the server, your application will continue to work without failing.
For those using Chef + Runit, we have extended the hectcastro/chef-statsd cookbook to include support for adding extra parameters to the StatsD config. You can find the extended cookbook here.
Graphite
We opted to use Graphite for storing and graphing our metrics because of its powerful graphing functions and built-in compatibility with StatsD.
Some things to be aware about with Graphite:
Storage retention
Ensure that your flush interval in StatsD matches the highest-resolution storage retention in your Graphite config. In our configuration we’re using Etsy’s recommended settings:
[everything_etsy_style]
pattern = .*
retentions = 10s:6h,1min:7d,10min:5y
priority = 100
Since 10 seconds is our highest storage resolution, our StatsD flush interval is also set to 10 seconds. Due to how Graphite stores its data, if this flush interval were lower, multiple stats for the same 10 second timestamp would reach Graphite, overwriting any of the previous values.
File sizes
For every new metric graphite pre-allocates a file capable of storing all the data defined by your retention config. If you’re not careful about how you choose to structure your metrics this can quickly eat up space on your servers hard drive. With the Etsy style configuration this is about 3.2MB per key.
Something to keep in mind when using StatsD is that some of the metrics types produce more then one key in Graphite; counters send count, rate, while timers send count, count_ps, lower, mean, mean_90, median, std, sum, sum_90, upper, upper_90. This means that a counter will use ~6.4MB and timers ~35MB
The above configuration is best for storing “overall” metrics instead of detailed ones. For example, in our 76insights app we track how many milliseconds API calls take to a specific platform. When logging metrics, we group them all under the same platform key platform.twitter.user_timeline instead of by screenname platform.twitter.{screen_name}.user_timeline. With this configuration, our storage usage remains constant and predictable.
In some cases detailed metrics are necessary, generally for these you don’t need to retain them as long; with Graphite you can define custom retention periods per key. Here’s how we use it to customize the storage retention for events triggered within our system:
[events]
pattern = .*.events.*
retentions = 10s:3d,60s:30d,10m:1y
Storage Aggregation
When moving from one retention resolution to another, Graphite needs to know how to downsample the data. For most cases this just involves averaging (the default for Graphite). Leaving this as-is would end up corrupting some of your metrics: counters (sum), as well as lower and upper ranges would all be invalid. You can read more about StatsD storage aggregation for Graphite here.
Visualizing it all
Now that we’re logging all these metrics, how can we start learning from them? Graphite is great at storing data, manipulating it and finally rendering it in various ways (including JSON) but the dashboard itself can be painful to use. In order to gain the most value out of your metrics you need a tool that you can use every day, one that you can put up on an extra monitor. Luckily a lot of great dashboards exist:
- Tasseo
- Dashing
- Cubism (when your rolling your own)
- Team Dashboard
- Graph Explorer
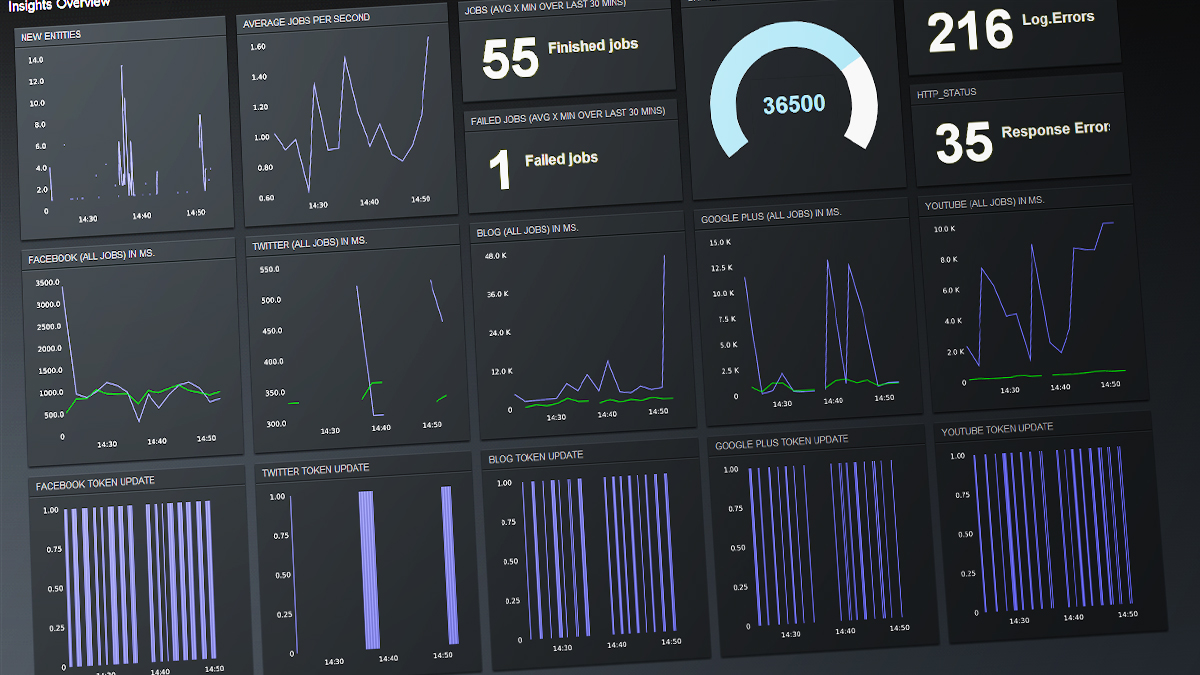
For our use case Team Dashboard served us best. It supports a variety of widget types and data sources and you can easily re-arrange widgets using drag + drop. Also, you can build any number of dashboard layouts which is great for grouping related metrics and experimenting with widgets.
When getting started with Graphite and learning about ways our metrics could be visualized, the following resources were very helpful:
- List of available functions in Graphite – Be sure to read through this page, when using the Graphite dashboard not all function options are exposed.
- Graphite Tips
Are you measuring business metrics for your application? We would love to hear how!
Pingback: Data: are you listening to what your product is saying?()
Pingback: 76Design | A Creative Digital Shop()